- BIST10012,151-0.94%
- USD49.220.00%
- EUR55.21+0.28%
- GOLD4,194.50-0.52%
- INTEREST37.00%-1.00
- BITCOIN82,961-0.85%
- October 13, 202619°
- BIST10012,151-0.94%
- USD49.220.00%
- EUR55.21+0.28%
- GOLD4,194.50-0.52%
- INTEREST37.00%-1.00
- BITCOIN82,961-0.85%
- October 13, 202619°
Exports down 9.5%, imports down 10.8% in May; trade deficit narrows
According to provisional data released by TÜİK and the Ministry of Trade, exports fell 9.5% and imports fell 10.8% in May. The foreign trade deficit narrowed by 15.6% year-on-year to $5.61 billion.


According to provisional foreign trade data for May prepared in cooperation with the Turkish Statistical Institute (TÜİK) and the Ministry of Trade, exports fell 9.5% compared to the same month last year to $22.461 billion.
Imports, on the other hand, fell 10.8% to $28.071 billion. The foreign trade deficit narrowed by 15.6% year-on-year in May to $5.61 billion. The export-import coverage ratio rose to 80% from 78.9% in May 2025.
In the January-May period, exports rose 0.2% to $111.118 billion, while imports rose 1.1% to $153.834 billion. The foreign trade deficit widened by 3.6% to $42.716 billion in the same period. The export-import coverage ratio fell to 72.2%.
Foreign Trade Excluding Energy and Gold
Exports excluding energy products and non-monetary gold fell 11.5% in May to $20.5 billion. Imports under the same scope fell 16.2% to $21.025 billion. The foreign trade deficit excluding energy and gold was calculated at $525 million, while foreign trade volume decreased 13.9% to $41.525 billion. The export-import coverage ratio was determined as 97.5%.
By economic activity, the share of manufacturing in exports was 94.5% in May, while agriculture, forestry and fishing accounted for 3.3%, and mining and quarrying 1.6%. In imports, according to the broad economic groups classification, intermediate goods accounted for 72.7%, capital goods 13.4%, and consumer goods 13.8%.
Foreign Trade by Country
In May, Germany ranked first in exports with $1.714 billion. It was followed by the US with $1.520 billion, the United Kingdom with $1.380 billion, Italy with $1.144 billion, and Spain with $922 million. Exports to the top five countries accounted for 29.7% of total exports.
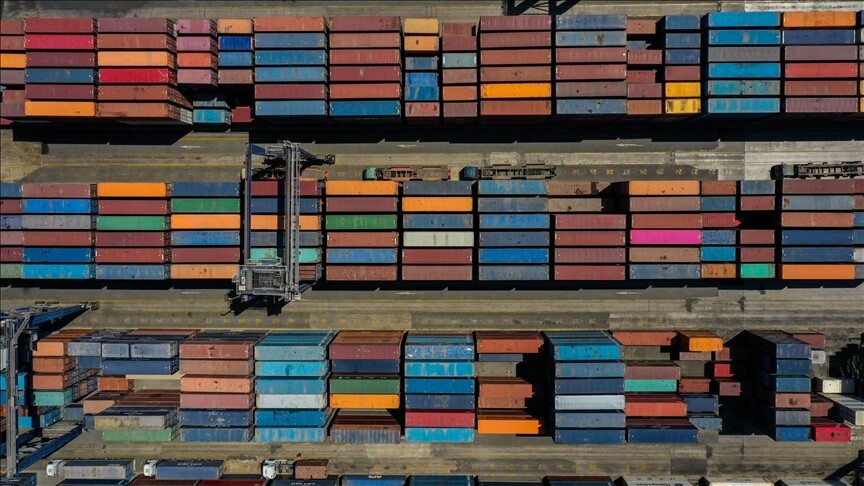
In the January-May period, Germany ranked first in exports with $9.276 billion, followed by the US ($6.945 billion), the United Kingdom ($6.776 billion), Italy ($5.891 billion), and France ($4.640 billion).
In imports in May, Russia ranked first with $3.758 billion. It was followed by China ($3.431 billion), Germany ($2.040 billion), the US ($1.208 billion), and Italy ($1.057 billion). Imports from the top five countries accounted for 40.9% of total imports. In the January-May period, China ranked first in imports with $21.035 billion, while Russia came second with $17.270 billion.
Seasonally and Calendar Adjusted Data
According to the seasonally and calendar adjusted series, exports fell 0.8% and imports fell 1.9% in May compared to the previous month. According to the calendar adjusted series, exports rose 4.8% and imports rose 4.3% compared to the same month last year.
Technology Intensity
According to the ISIC Rev. 4 classification, the share of manufacturing industry products in total exports was 94.5% in May. The share of high-technology products in manufacturing industry exports was recorded as 3.1%. In imports, the share of manufacturing industry products was 77.1%, and the share of high-technology products in manufacturing industry imports was 11.8%.
Special Trade System Data
According to the Special Trade System, exports fell 8.9% year-on-year in May to $20.634 billion, while imports fell 10% to $26.389 billion. The foreign trade deficit narrowed by 13.6% to $5.756 billion. The export-import coverage ratio rose to 78.2%.
In the January-May period, according to the Special Trade System, exports rose 1% to $101.934 billion, while imports rose 2.1% to $145.583 billion. The foreign trade deficit widened by 4.7% to $43.649 billion.
Stay Updated with The Turkiye Times
Subscribe to be informed about special news, developments and announcements. We will keep you informed.
By signing up, you agree to our Privacy Policy