- BIST10012,151-0.94%
- USD49.220.00%
- EUR55.21+0.28%
- GOLD4,195.90+0.13%
- INTEREST37.00%-1.00
- BITCOIN82,500-1.40%
- October 13, 202618°
- BIST10012,151-0.94%
- USD49.220.00%
- EUR55.21+0.28%
- GOLD4,195.90+0.13%
- INTEREST37.00%-1.00
- BITCOIN82,500-1.40%
- October 13, 202618°
Türkiye's August exports rise 8.1% to $23.5 billion
Türkiye's August exports rose 8.1% year-on-year to $23.467 billion. Imports increased 10.5% during the same period, while the foreign trade deficit reached $5.239 billion; exports in January-August totaled $184.996 billion.
Scraper SystemUpdated:


Türkiye's August exports rose 8.1% year-on-year to $23.467 billion. Imports increased 10.5% during the same period to $28.706 billion.
The foreign trade deficit rose 22.3% year-on-year in August, increasing from $4.283 billion to $5.239 billion. The export-to-import coverage ratio was 81.7%.
January-August deficit reaches $65.8 billion
Exports totaled $184.996 billion in January-August, up 4% from the same period last year. Imports rose 5.3% to $250.790 billion.
During this period, the foreign trade deficit increased 9.3%, rising from $60.206 billion to $65.793 billion. The export-to-import coverage ratio was calculated at 73.8%.
Bolat expects current account surplus in August
In a written statement on the August foreign trade data, Trade Minister Ömer Bolat said exports reached a record level in the first eight months of the year despite regional wars and global headwinds. Bolat said the current account was expected to post a surplus of more than $3 billion in August.
Bolat said the $282 billion target for annualized exports was expected to be reached as of September, adding that work continued to exceed the $410 billion target for exports of goods and services. He said the share of high value-added and technology-intensive products in exports would be increased, and that measures protecting domestic production against unfair competition would be maintained within the framework of international obligations.
Foreign trade excluding energy and gold
Exports excluding energy products and non-monetary gold rose 2.7% in August to $20.831 billion. Imports under the same category increased 9.6% to $21.919 billion.
The foreign trade deficit excluding energy products and non-monetary gold stood at $1.088 billion. Foreign trade volume in this category rose 6.1% to $42.749 billion, while the export-to-import coverage ratio was 95%.
Manufacturing accounts for 93.6% of exports
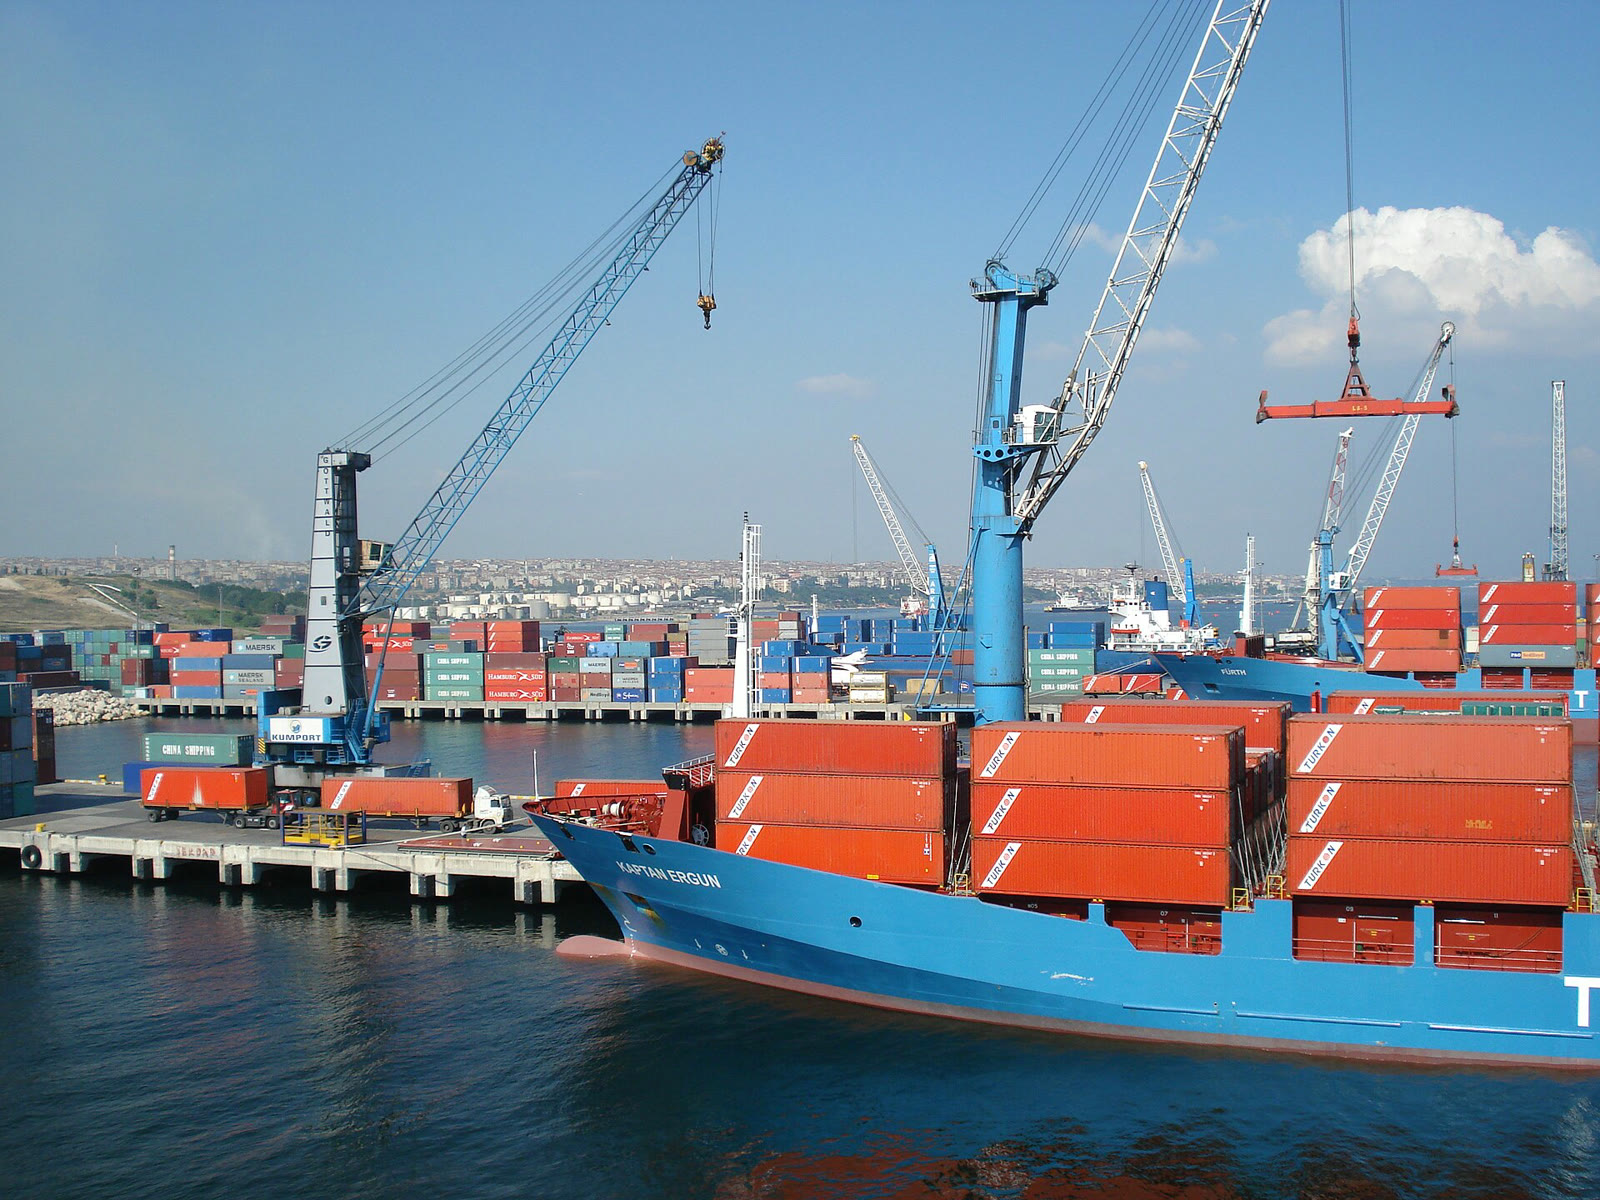
Manufacturing accounted for 93.6% of exports in August. Agriculture, forestry and fishing accounted for 3.2%, while mining and quarrying accounted for 2.3%.
In January-August, manufacturing's share of exports was 93.9%, while agriculture, forestry and fishing accounted for 3.6% and mining and quarrying for 1.8%. In August, intermediate goods accounted for 70.7% of imports, capital goods for 13.5% and consumer goods for 15.5%.
Germany leads exports and China leads imports
Germany was the top export destination in August, with $1.760 billion in exports. Germany was followed by the United States with $1.731 billion, the United Kingdom with $1.203 billion, Iraq with $1.079 billion and Switzerland with $1.073 billion. Exports to the top five countries accounted for 29.2% of total exports.
Germany also ranked first in exports during January-August, with $15.045 billion. It was followed by the United States, the United Kingdom, Italy and France. The top five countries accounted for 29.3% of total exports.
China ranked first in August imports with $4.706 billion. It was followed by Germany with $2.068 billion, Russia with $1.935 billion, the United States with $1.872 billion and Italy with $1.374 billion. The top five countries accounted for 41.7% of total imports.
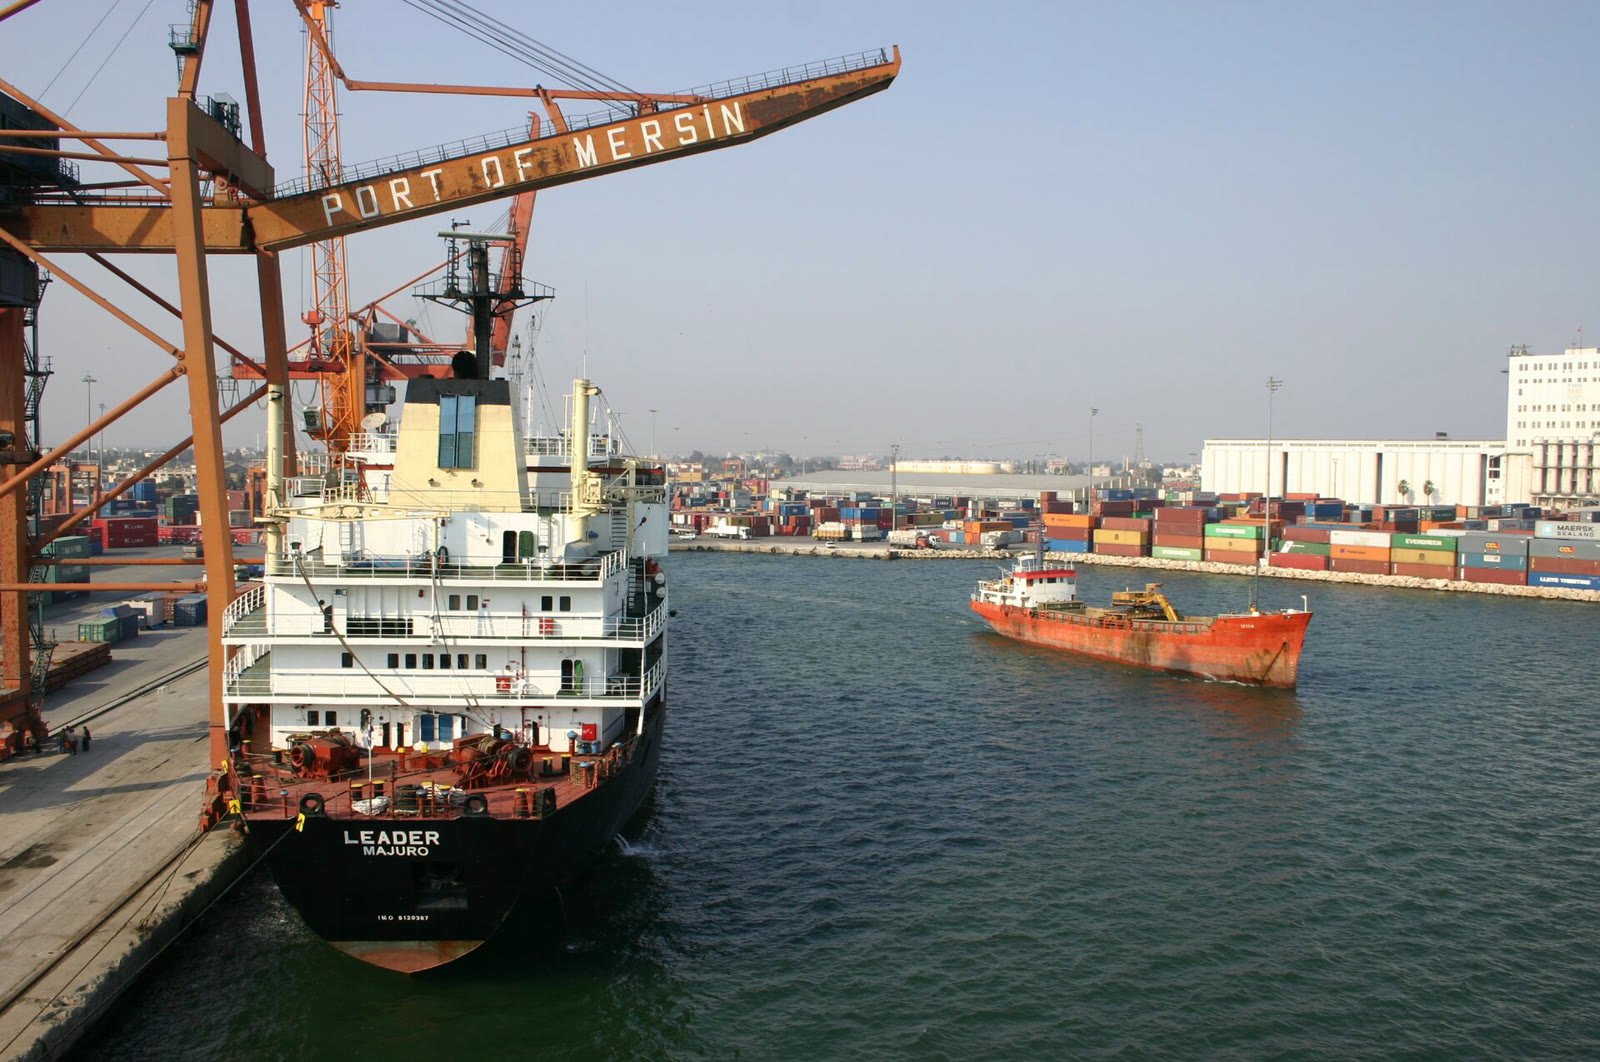
China maintained its position as the leading source of imports in January-August, with $36.055 billion. China was followed by Russia, Germany, the United States and Italy. Imports from the top five countries accounted for 41.4% of total imports.
Seasonally adjusted data and technology intensity
According to the seasonally and calendar-adjusted series, exports rose 0.6% in August from the previous month, while imports declined 1.1%. In the calendar-adjusted series, exports increased 8.1% and imports 10.5% year-on-year.
Manufacturing products accounted for 93.6% of total exports in August. High-technology products accounted for 3.6% of manufacturing exports. In January-August, these ratios were 93.9% and 3.7%, respectively.
Manufacturing products accounted for 82.3% of total imports in August, while high-technology products made up 12% of manufacturing imports. In January-August, the corresponding ratios were 80.1% and 12.1%.
Special Trade System data
Under the Special Trade System, exports rose 7.2% year-on-year in August to $20.943 billion. Imports increased 8.1% to $26.654 billion, while the foreign trade deficit rose 11.4% to $5.711 billion.
Under this system, the export-to-import coverage ratio was 78.6%. In January-August, exports totaled $168.630 billion, imports $235.825 billion and the foreign trade deficit $67.195 billion. The export-to-import coverage ratio was calculated at 71.5% during the same period.
Stay Updated with The Turkiye Times
Subscribe to be informed about special news, developments and announcements. We will keep you informed.
By signing up, you agree to our Privacy Policy